
It’s time for the Lafayette Parish Market Update. It is important to know the analysis is only for Lafayette Parish and only includes detached single-unit properties. We will analyze the change in sales volume and the change for the median, average, and average price per square foot. We will also give some insight around the drivers of some of this change and some of the areas of caution.
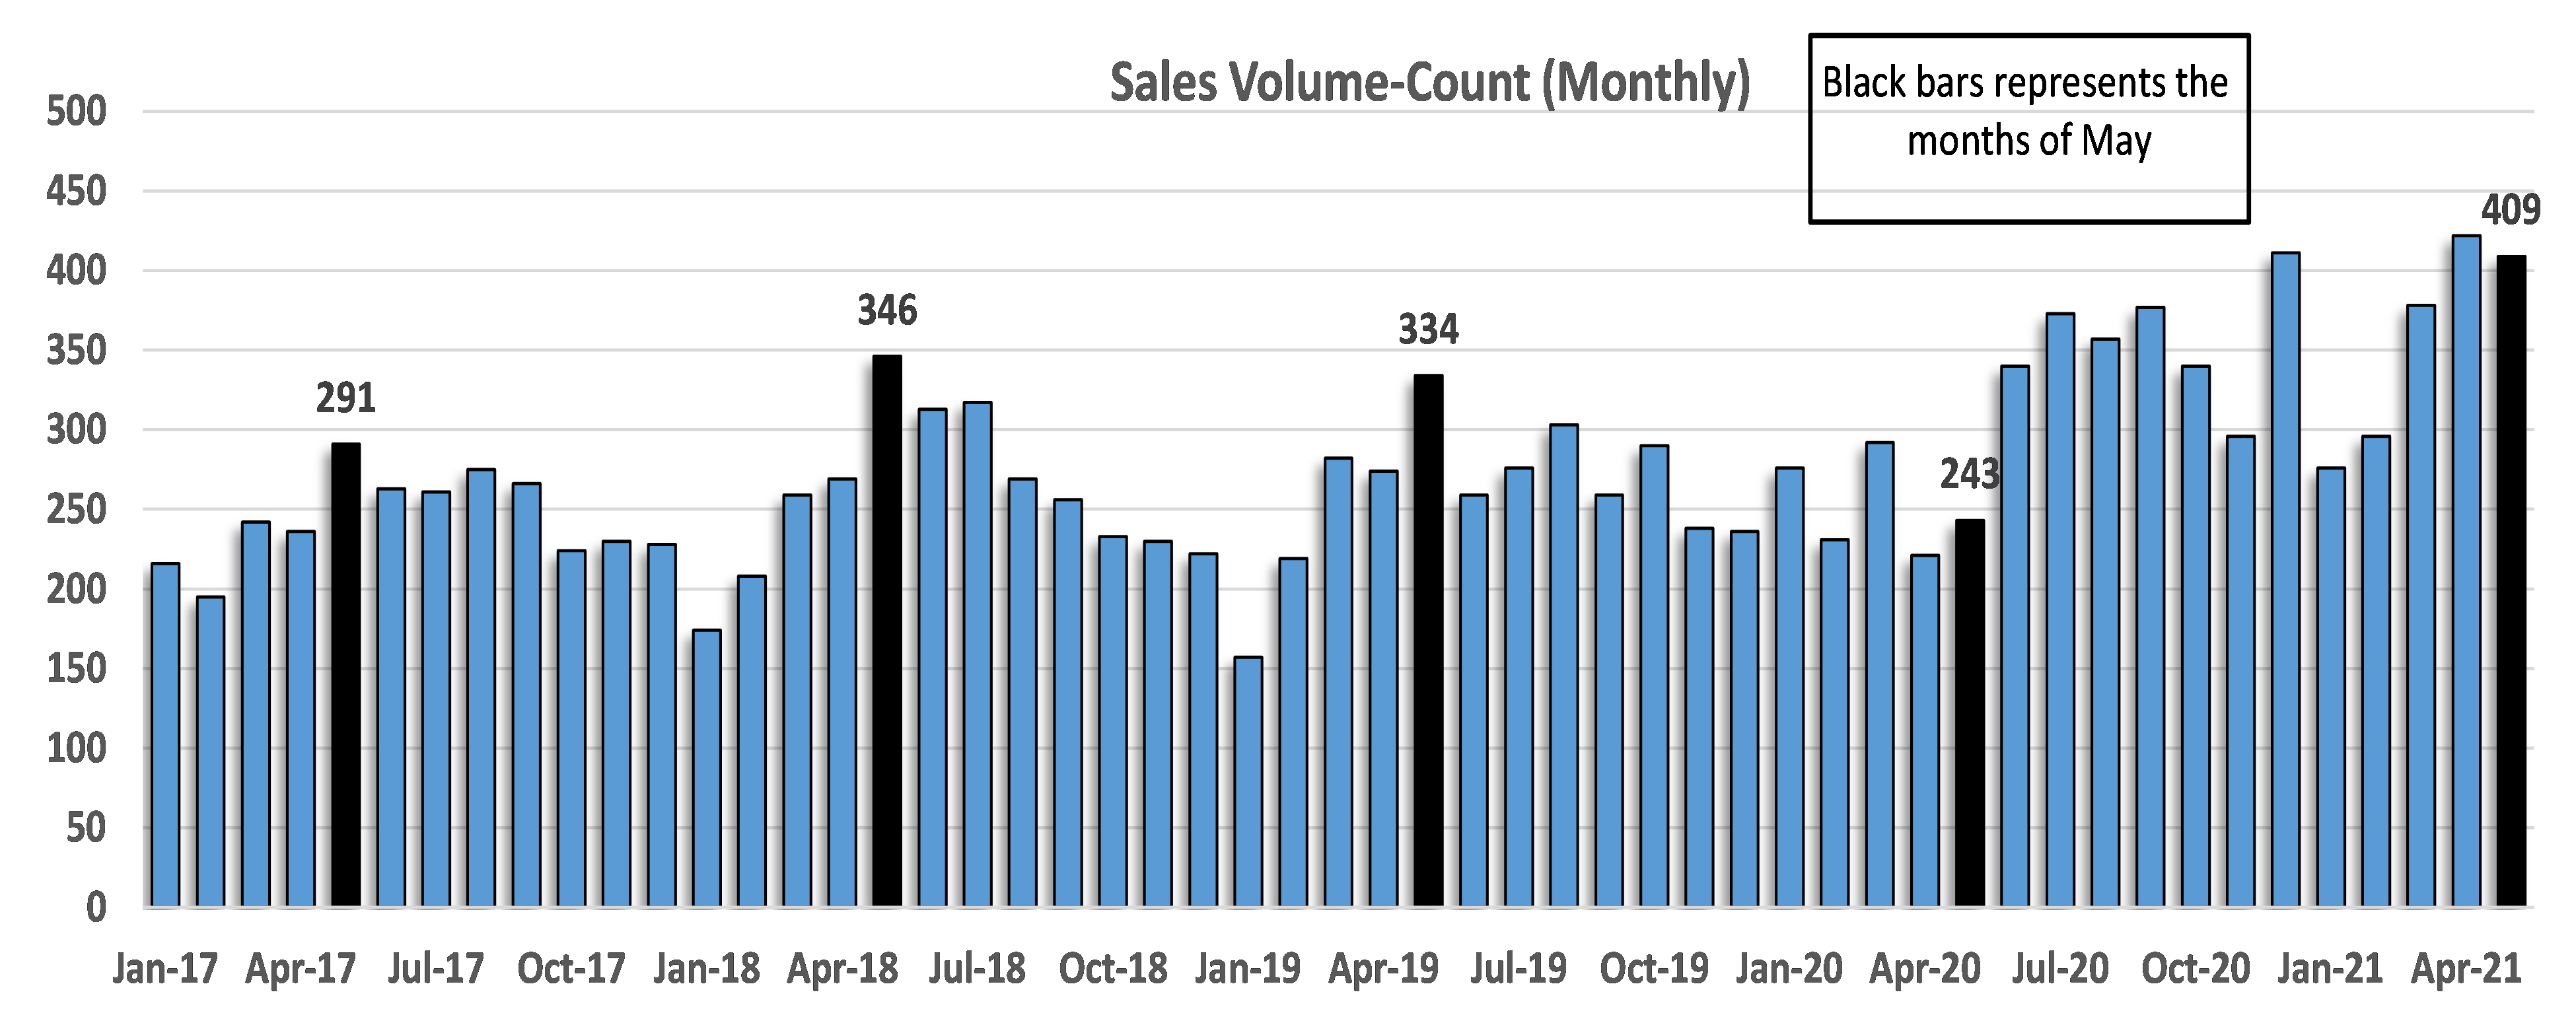
Sales Volume:
The first chart shows the sales volume by month. The black bars represent the months of May. For May 2021, there’s been a 68% increase in sales volume for this month compared to May 2020. Lock down was in place during parts of May last year, but even compared to previous years, sales are up significantly.
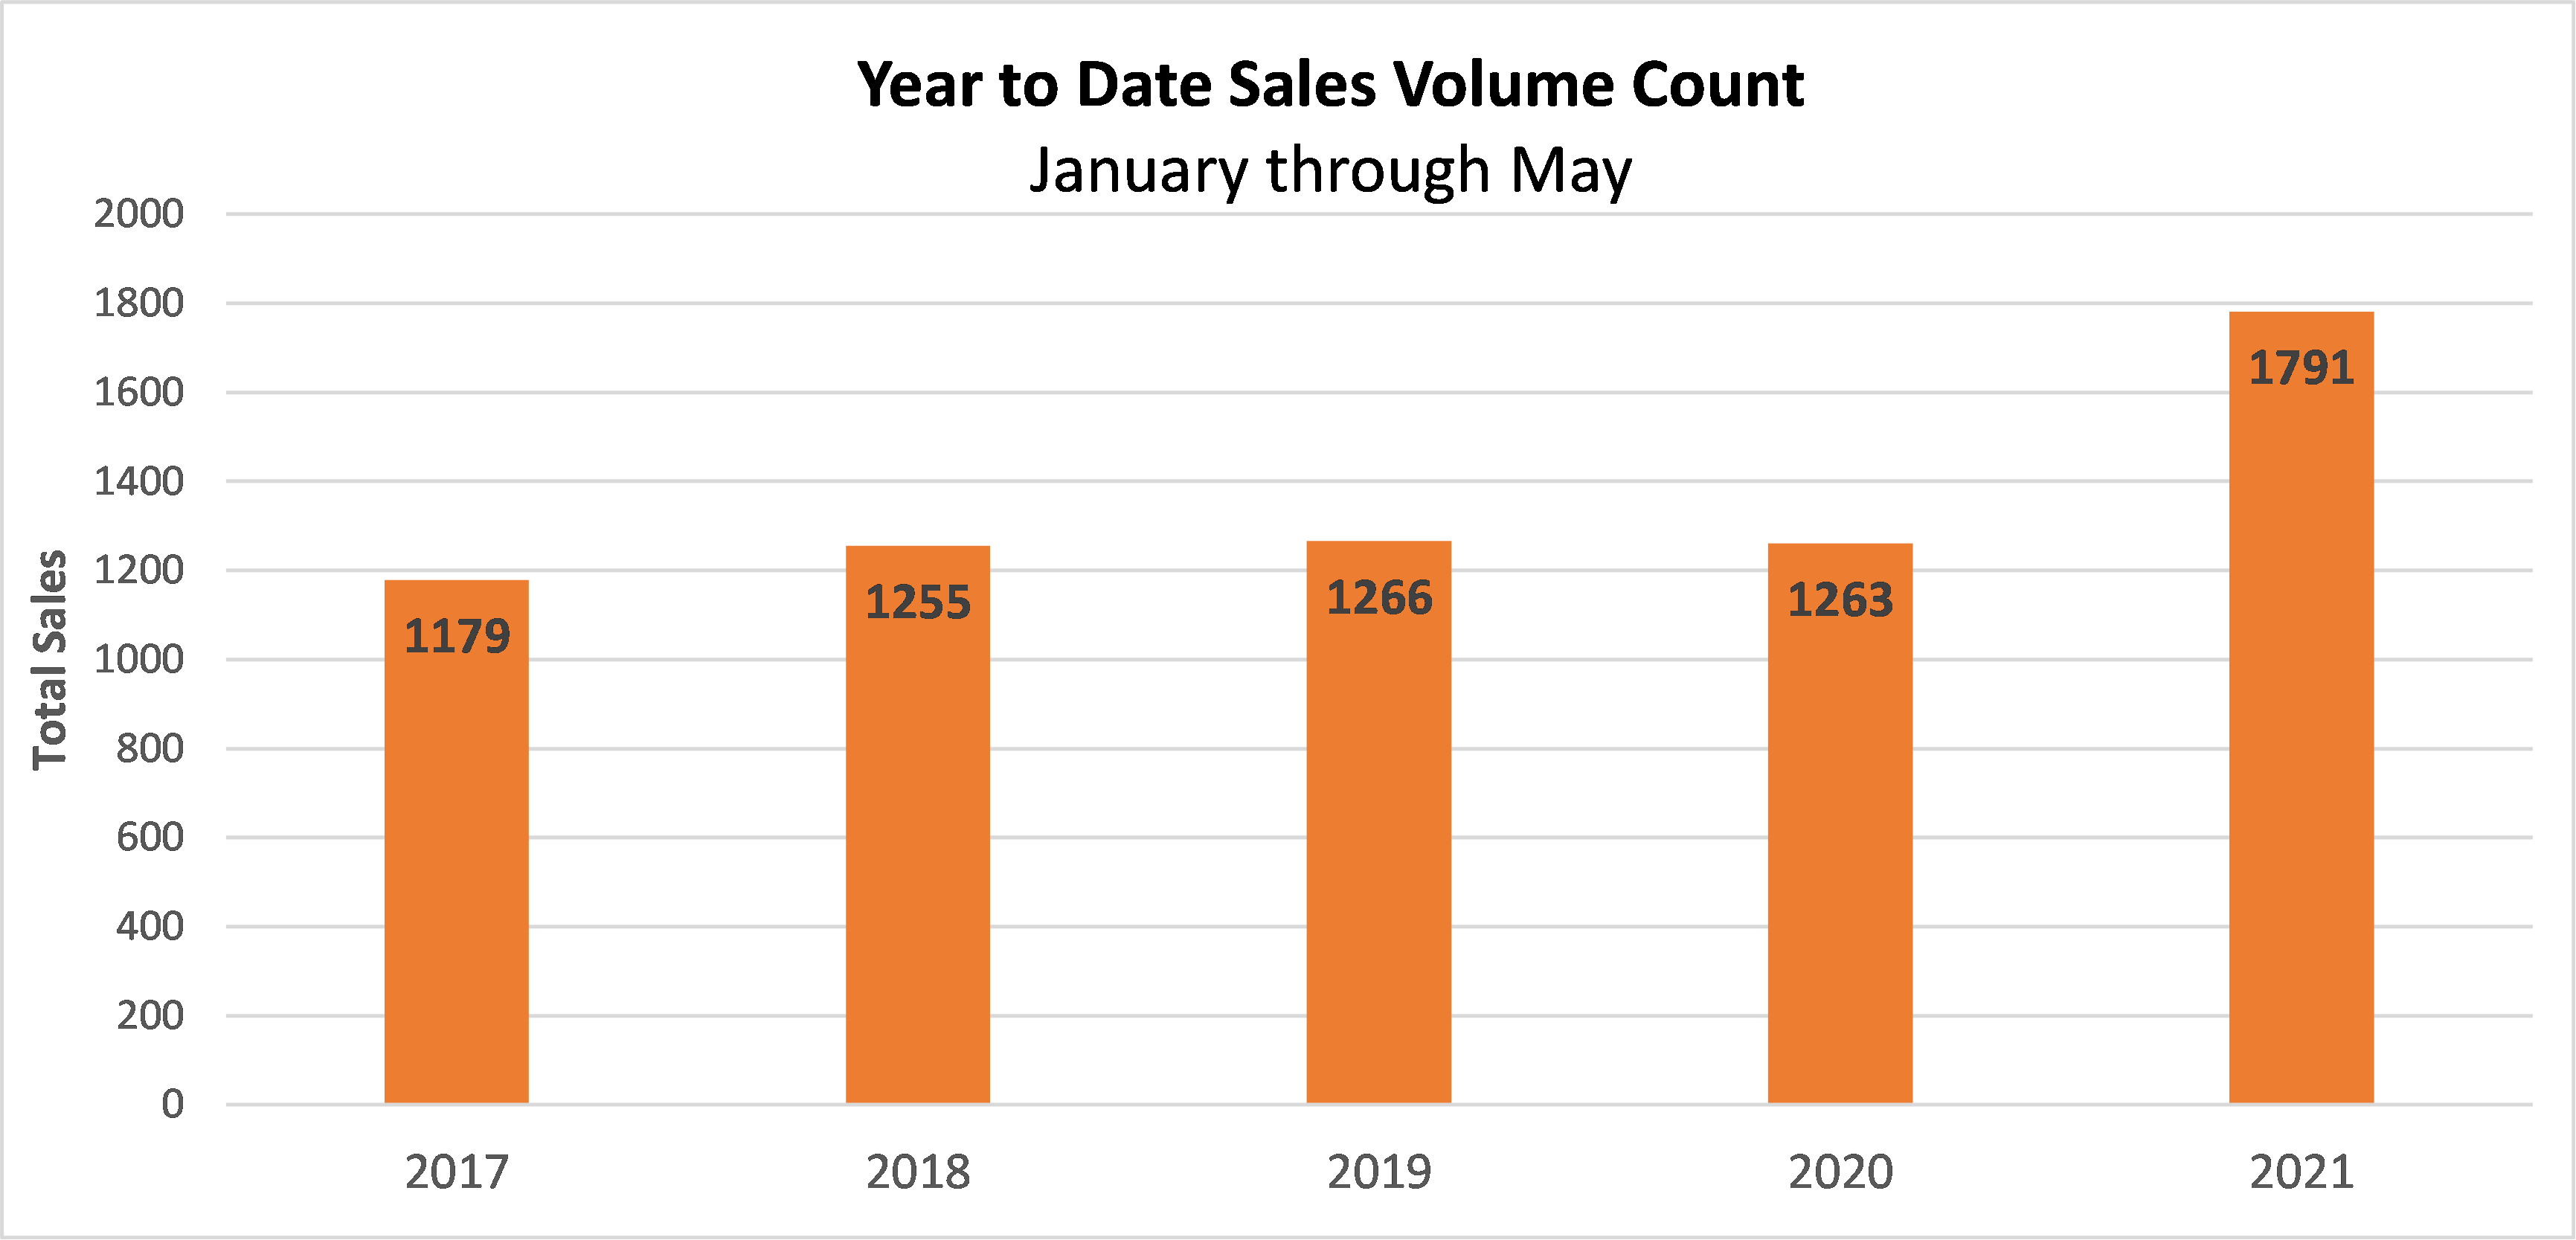
The second chart shows the year-to-date sales volume. For January through May, there has been a 42% increase in sales as compared to both 2019 and 2020!!!
Year-Over-Year Data:
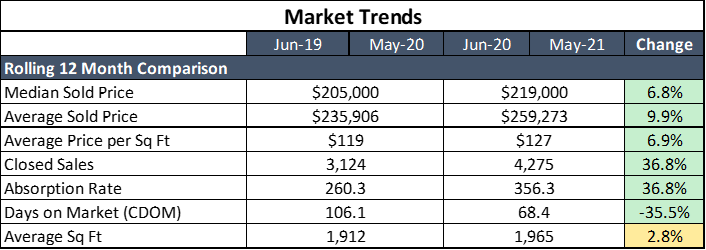
The next chart details the median price, average price, and average price per square foot. All three metrics are reflecting a favorable change for the past 12 months as compared to the previous 12-month period. It is important to note the average living area has increased by 2.8% over this time period. In a stable market with all else equal, we would expect the median and average sales price to increase with an increase to the average living area. The living area is one of the most influential characteristics when it comes to value, but it is not typically a one-for-one increase, though. There are other factors also contributing to the increase in prices.
The chart also highlights the significant increase in the number of closed sales and the decrease in average days on the market. The changes are even more significant than when we last looked at the rolling trends in March. The average days on the market for the past 12 months have fallen to about 68 days, and we expect to see this continuing to decline. During the month of May 2021, the average was only 37 days on the market.
The chart below highlights the trend for the median sales price, average sales price, and average price per square foot. This chart shows you how the metrics are increasing over time. There appeared to be a slight dip in the sales prices during December 2019 and January 2021, but there has been a significant climb since that time.

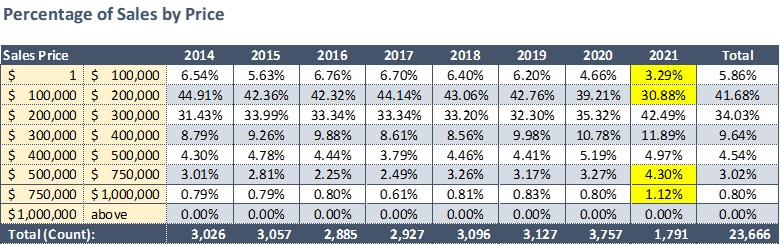
Change In Percentage Of Sales In Each Price Range:
The table below shows the percentage of sales in each price range. The price ranges are on the left side of the chart. The percentage of sales in each price range is tracked over the last eight years. In 2021, there has been some shift. Market share has decreased in the two lower price ranges, while the $500,000 to $1,000,000 price range has increased its market share slightly. This movement has also reflected in some of the changes highlighted in the rolling 12 –month comparison table.
There are a couple of items real estate professionals should keep in mind when reviewing data on a macro level for the entire parish:
- The data includes ALL sales in the Parish. This includes properties that sold over a million dollars and properties that sold for under $20,000. If you are trying to value a property, it is IMPORTANT to look at the market segment which includes only properties that are similar to your subject property and that would attract the same pool of buyers. The various market segments within Lafayette Parish can indicate different trends. To rely only on this data and apply it to every property in Lafayette Parish is simply WRONG!!!
- There are several factors other than just supply and demand that have caused the median and average sales prices to increase. First, data indicates the average size of the living area has increased over time. We expect the sales prices to increase as the living area increases even in a stable market where the supply and demand forces are not strong. Second, there appears to be a general shift to higher-end properties. Factors such as interest rates, the economy, and the job market must all be taken into consideration.
Conclusion:
While values have increased for our market area, it is important to understand the data that you are looking at before making a blanket statement about the change. It is incredibly important to look at the market segment when determining how values have changed for the property that you are trying to value.
If you have any questions, please feel free to reach out to me. You can contact me by email at AcadianaAppraisals@gmail.com. You can also call or text at 337-714-8378. If you are a real estate professional and would like to join our private Facebook group, look for us at “Ask the Acadiana Appraiser”.