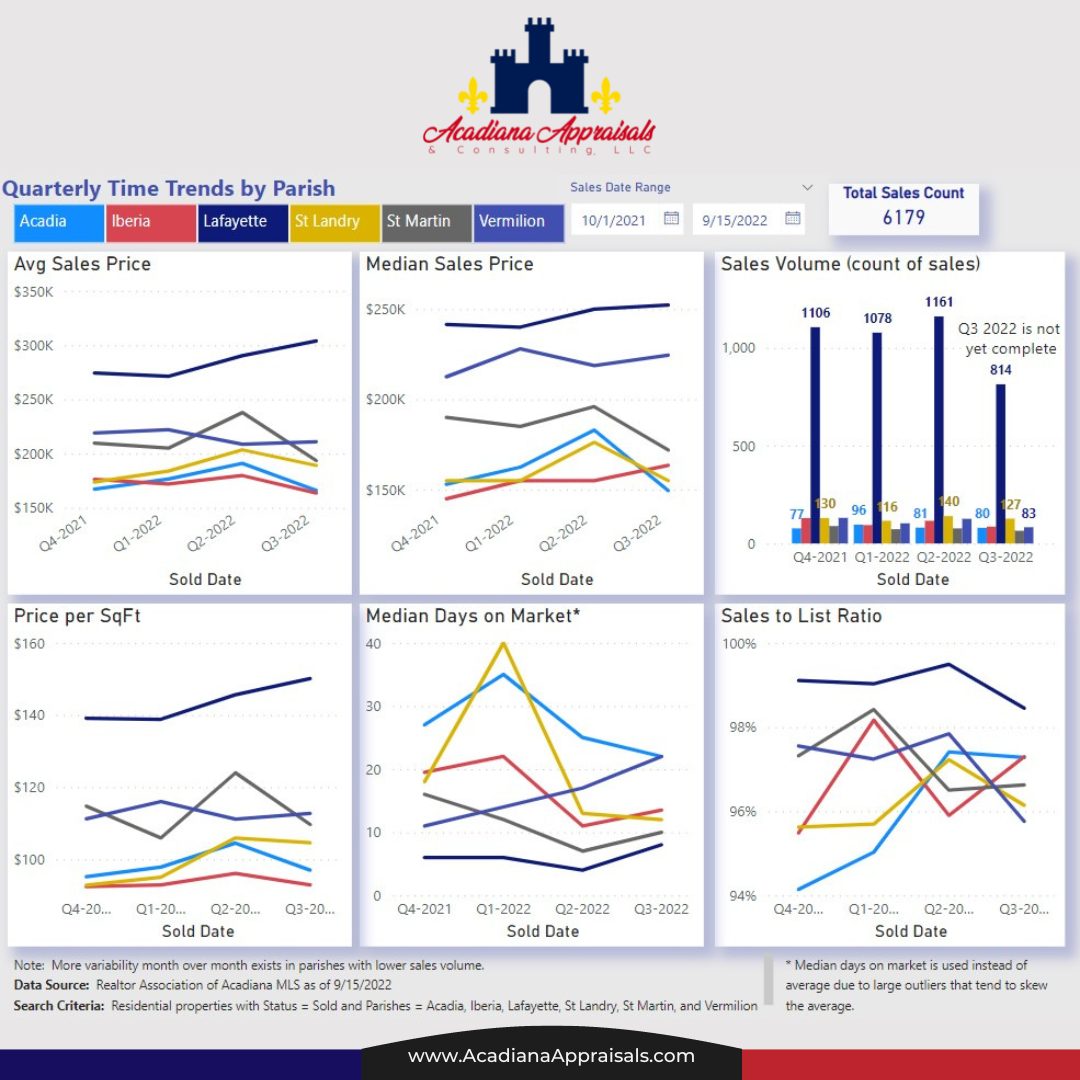

One of the common ways we monitor market stats is parish by parish. This graphic shows how each market behaves a little different. While the end of the 3rd quarter is about 15 days away, we can still gather some good info on the general direction of the data.
Interesting takeaways:

Lafayette parish’s sales volume tends to be more than double the volume of the other 5 parishes combined. The stats tend to be a little “smoother” for the parishes like Lafayette with more sales.
Sales prices in Lafayette parish appear to still be slightly increasing.

Vermilion parish shows somewhat stable prices.

The data for the other parishes are indicating some decline.


Keep in mind, there’s still so many ways to slice the data even within a parish. Sales price ranges, MLS areas, home sizes and ages, to just name a few. The stats represent the average or median and don’t apply to EVERY SINGLE house in a parish.