
Here is my monthly Lafayette market analysis update for October 2019. The purpose of this article is to describe how the overall Lafayette Parish real estate market is performing.
When I am working on an appraisal, I typically do a thorough market analysis for each market segment on every property. This analysis represents how competitive sales in the market are performing over time. However, it is also necessary to know how the larger market is performing. The larger market that I am referring to is the Parish that each property is located in. For this article, I will analyze sales for Lafayette Parish. The data analyzed is strictly from the Realtors Association of Acadiana Multiple Listing Service (RAA-MLS). Most “For Sale By Owner” Sales or Sheriff Sales are not included in the analysis.
I have sought out the advice from other appraisers locally and nationally to develop the charts and graphs for the Lafayette market analysis in this report. For the analysis, a series of charts and graphs are included with a brief explanation.
Year over Year statistics:
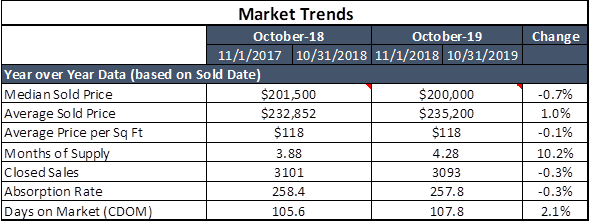
The chart above shows the year over year statistics for several metrics. There is a subtle change in the metrics used in this chart. The median sales price is indicating less than a 1% decrease in prices, while the average sales price has increased by 1%. Additionally, the average price per square foot has only decreased by 0.1%. I typically do not classify the market as changing, whether that be increasing or decreasing, unless the change is more than 3%. The reason that I have a margin of error of 3% is that each buyer and seller has slightly different motivations in each transaction. A house could be listed for sale for $200,000. One buyer may be willing to pay full price for the house, while the next buyer may only pay $195,000. Each willing participant has their own motivation; therefore, I only determine the market as increasing or decreasing after the change is greater than 3%.
The months of housing supply has also increased over this time period by 10.2%. This is primarily because the active number of listings has been steadily increasing, as will be shown later. Also, the number of closed sales and the absorption rate has increased by 21.2%. This is a positive factor in the market because it shows that more homes have been purchased. Lastly, the days on market has increased slightly, but only be 2.2%, or two days.
Year to Date Statistics:
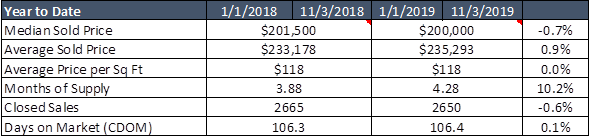
The chart above is similar to the year over year chart; however, it is showing the statistics for the year to date sales. So, it is showing the statistics for each year as of January 1 until the end of October. As you can see, the year to date statistics is very similar to the year over year statistics. Most of the metrics are within the 3% margin of error; therefore, the metrics are indicating that property values in Lafayette Parish are stable. One area where change is occurring is in the months of supply. Last year there were 3.88 months of supply, while this year, there is 4.28 months of supply. This is a 10.2% increase. As you will see later on, this is due to the rising number of active listings in the market over the past few years.
Monthly Data:
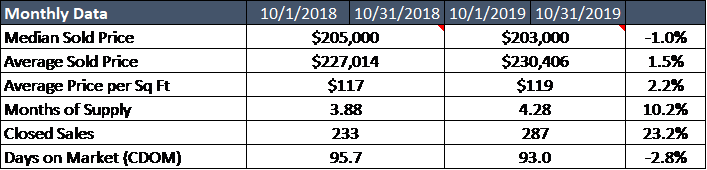
This chart is showing a comparison between sales from October 2018 versus October 2019. The median sales price and the average sales price are in sync with the year over year statistics. However, the average price per square foot has changed by 2.2%. While this is still within the 3% margin of error, it is more change than in the year over year statistics. It is worth keeping an eye on in the coming months to see if it continually increases.
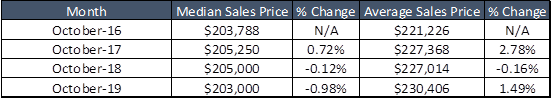
The chart above tracts the median sales prices and the average sales prices in Lafayette during the month of October over the past few years. As you can see, the median sales price has declined over the past two years, while the average sales price has gone up. The average sales price could be affected by higher-end homes in the area that is driving the average price up. The median sales price is less affected by extremely high or low sales; therefore, it is different from the average sales price.
Scatter Plot:
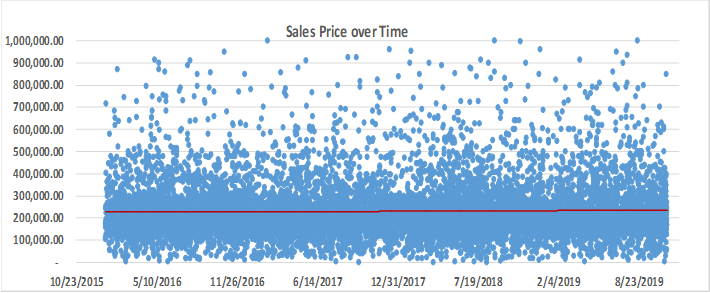
The chart above shows a scatter plot for all sales in Lafayette Parish over the past four years. The y-axis has been decreased to only show the sales under $1,000,000 to show the trend line better. The trend line shows a very slight uptick in values. However, the change is very small, and it is essentially flat. Lafayette Parish sales have been stable for several years now.
Price Metrics:
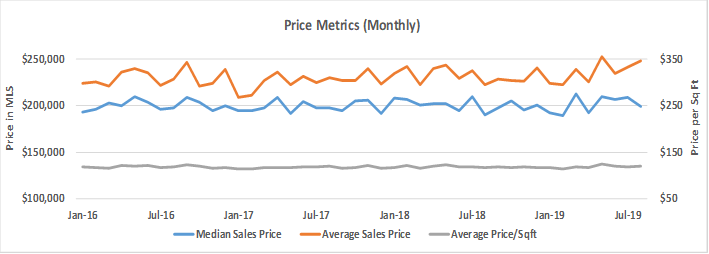
The chart above trends the median sales price, the average sales price, and the average price per square foot over time. This graph confirms the previous charts and graphs that values are mostly stable over time. There is, however, a recent uptick over the past 6 months. I will continue to analyze this over the coming months to see if values continue to rise or if they stay in line with the historical ranges.
Market Inventory:
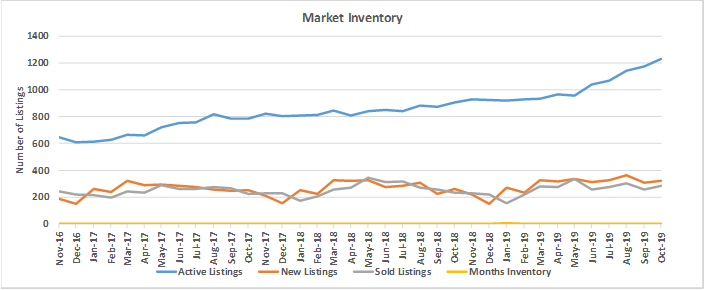
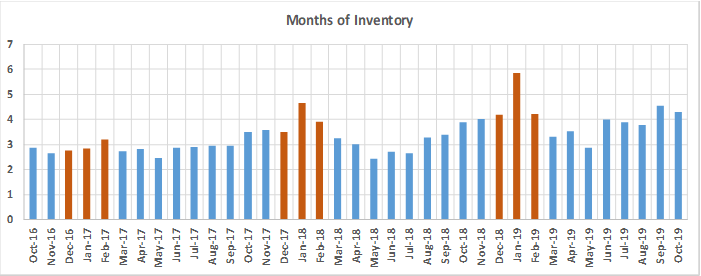
The chart above shows the number of active listings, sold listings, and months of inventory over time. The blue line represents the active listings, which has been steadily increasing over the last three years. Because of this increase, the months of inventory (as shown in the year over year statistics) has also increased. The number of sold properties has been fairly stable for the past eight months. The chart shows that there was a slow down last year, starting around August and lasting until March. This is when interest rates rose. They have since gone down, and the number of sales has increased since. Although this chart does not show the months of inventory too well, the one below shows how the months of housing supply has changed over time. Currently, there are slightly over 4 months of inventory. As you can see, during winter months over the past two years, the months of inventory has risen due to less activity in the market.
Conclusion:
Based on the metrics included in this analysis, values are stable in Lafayette Parish. There is some change, as is expected in real estate; however, the change is within a 3% margin of error. Recently, there has been an uptick in sales prices, but active listings also continue to increase. It will be interesting to see how prices continue to change in the future.
Next time I hope to include additional graphs to give more insight into how the market is performing. Again, this market analysis is showing all properties in Lafayette Parish. It is important to know how your specific market segment is performing when you are considering purchasing or selling a home. If I can be of assistance to you in the future, please do not hesitate to contact me (c. 337.254.2215, email: Lduple4@gmail.com)
I hope that this was insightful, and I look forward to the next Lafayette market analysis update in December. If you are interested in other articles that I have written, you can check them out at www.acadianaappraisals.com or on my Linkedin page.