
January 12, 2020
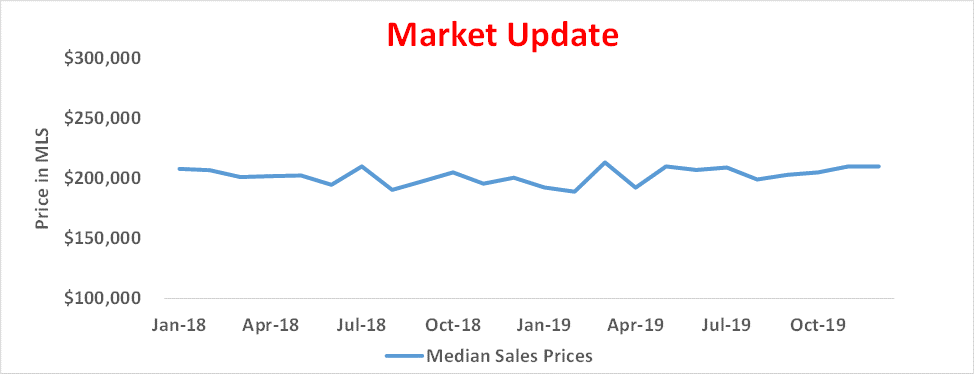
An updated look at the Lafayette Parish market indicates the market is still stable; however, slight changes are being observed.
In November, I last took an in-depth look at the overall market trends for the Parish. The overall market at that time was indicating relatively stable trends. A couple of months later, we still see stability, but some metrics are indicating some minimal improvements.
- Sales prices in December 2019 similar to those in December 2018, but the number of closed sales increased by 6% and the days on the market decreased by almost 11 days
- Very minimal, but positive, movement in overall sale prices for the year of 2019 as compared to the year of 2018
- During 2019, some pickup in sales prices for homes priced in the $300 thousands while other price ranges remained relatively the same
- 2020 is showing a good start for the year. Sales prices and the number of sales are up quite a bit as compared to what was seen in 2019.
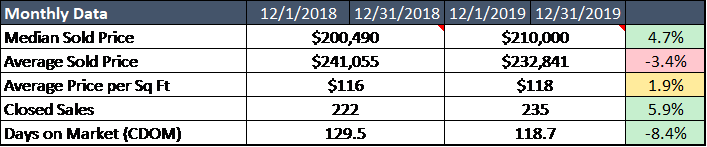
December 2019:
The first chart shows how the market was performing for December 2018 vs. December 2019. The median sales price rose by 4.7%, while the average sales price declined by 3.4%. The statistics differ because the average is affected by outliers, while the median is not. So, in this data set, the lower-priced outliers are affecting the average sales price.
The number of closed sales and the days on the market have both had favorable changes. The number of closed sales increased by almost 6% in December 2018. The chart is showing that there was a negative change in the days on the market, the fewer days on the market the better in real estate.
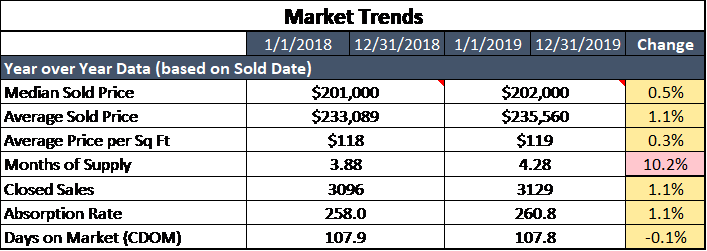
Year over Year:
The next chart shows the year over year trends for Lafayette Parish Market. The market is still considered stable because the changes in the median sales price, average sales price, and average price per square foot all have minimal change. The change is not enough to classify the market as increasing. Although most of the statistics are indicating a stable market, they are still moving in a favorable direction.
The only statistic that is showing an unfavorable result is the months of housing supply. The months of housing supply represents how long it will take to sell properties that are currently active. The number of active listings is growing faster than the number of houses that are being sold.
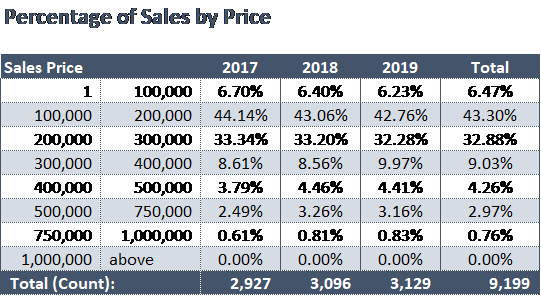
Percentage of Sales by Price:
Below is an interesting chart that shows the percentage of sales by price range over the past few years. What stands out here is that the majority of properties that are being sold have a sales price from $100,000 to $300,000. Also, properties that have sold from $300,000 to $1,000,000 have had an increasing portion of the market share in the past couple of years. As you can see, the number of sales of $1,000,000+ homes is so small that it does not even register on the chart.
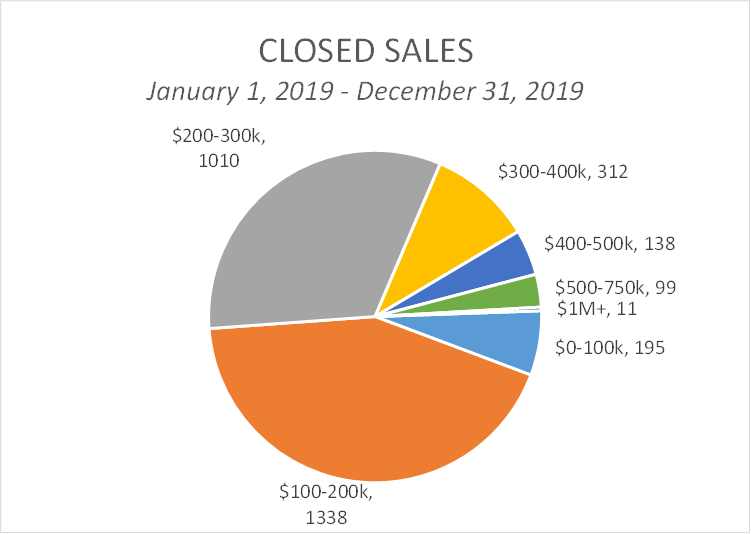
Pie Chart
The pie chart below shows similar information as the chart above, but instead of showing the data as percentages, it shows the total number of sales in each price range for 2019. The largest price ranges are $100,000-$300,000 (75.04%). As you can see, the higher end price range takes up a small percentage of the total market.
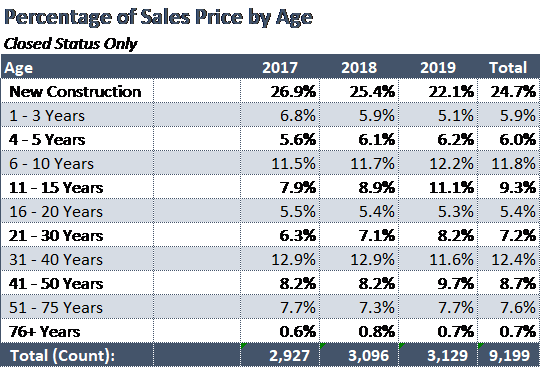
Percentage of Sales by Age Range:
This next chart shows the percentage of homes in each age range. The age ranges are the ones used in MLS. What’s interesting here is that New Construction and 1 -3-year-old homes decreased from 2017 to 2019 in the Lafayette Parish Market. New construction has slowed down slightly over this time, which is consistent with the number of permits pulled over this time period. Although the percentage of sales decreased during this time period, they still take up the largest percentage of sales over this time.
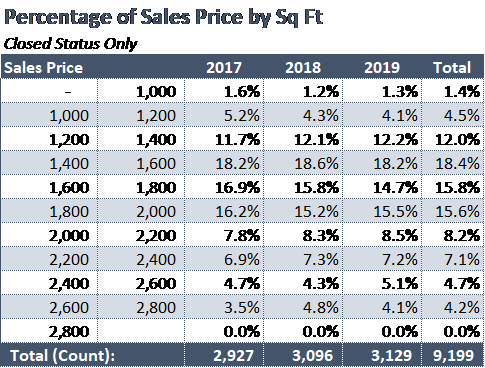
Percentage of Sales by Square Foot:
This next chart shows the percentage of sales for homes grouped by the living area square footage. As you can see from the chart, homes sold in Lafayette Parish are typically between 1,200 sqft and 2,000 sqft. The chart also shows that after 1,600 sqft, the larger the living area of the home, the less of a percentage it takes up in the market place. While there are plenty of homes that have over 2,800 square feet of living area, the number is minimal when compared to the rest of the market. This is why the chart shows homes with 2,800 square feet as having 0.0% of the sales.
2020 So Far…
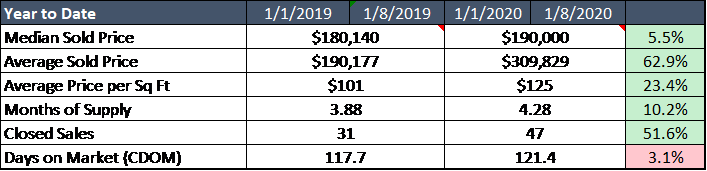
The next chart is showing year to date sales. Although there is a limited amount of time in this analysis because we just started the New Year, it is still interesting to look at. Does anything stand out in the chart below?
I noticed a huge increase in the average sales price (62.9%), with only a 5.5% increase in the median sales price. Could this be right? Well looking at the data a little more closely, this year in Lafayette Parish there has been a sale for $1,408,486 and one for $2,900,000. Last year the highest sales price in the first 8 days of the year was only $479,000. This illustrates a little more clearly how outliers affect averages, while typically, they do not affect the median.
The high sales have also affected the average price per square foot in 2019. It shows that there has been a 23.4% increase in using this metric.
Another positive factor is that the number of closed sales has continued to increase from this time last year, which was also true for the previous month.
I hope that this analysis was informative for how the overall Lafayette Parish is performing. Hopefully, you have a more in-depth view of how the market is performing going into this New Year. I would like to hear your thoughts about the Lafayette Parish Market.
Remember that this analysis includes all sales in Lafayette Parish Market. If you are in the market to sell or purchase a home, it is important to look and see how your specific sub-market is performing. If I can be of assistance to you in the future for any real estate appraisal needs, please do not hesitate to contact me at 337.254.2215 or Lduple4@gmail.com.
Data Source: MLS, detached single-family homes sold in Lafayette Parish