
February 6, 2020:
An updated look at the Lafayette Parish Market indicates the market is still stable; however, slight changes are being observed.
Was January a busy month for you? Based on the number of properties sold, it most likely was for Realtors and Lenders in the Lafayette Parish Market. Sales in Lafayette Parish for the month of January are up BIG TIME from last year. In fact, there were more sales in January 2020 than there have been in the month of January for the last 10 years.
Last month, I took an in-depth look at the overall market trends for Lafayette Parish. The overall market was considered stable; however, there were some favorable statistics. This month continues the favorable trend.
- The number of sales in January 2020 increased by 73% in comparison to January 2019.
- The sales volume was 91% higher this January as compared to January 2019.
- Year over year trends continues to see favorable changes.
If you’re interested in some of the details and data, take a look below.
Monthly Data for January:
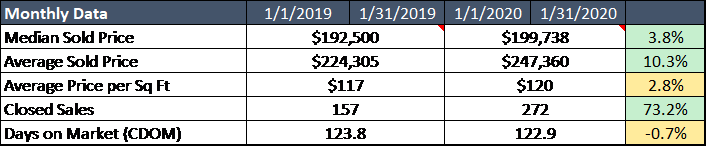
The chart below shows how the market was performing for January 2019 vs. January 2020. In this chart, the median sales price, average sales price, and average price per square foot all have favorable statistics. The median and average sold price is actually indicating that sales prices increased by a significant amount this January as compared to last January. Average prices can be affected by outliers such as a couple of $1 million+ properties, so the median sales price is often a better indicator.
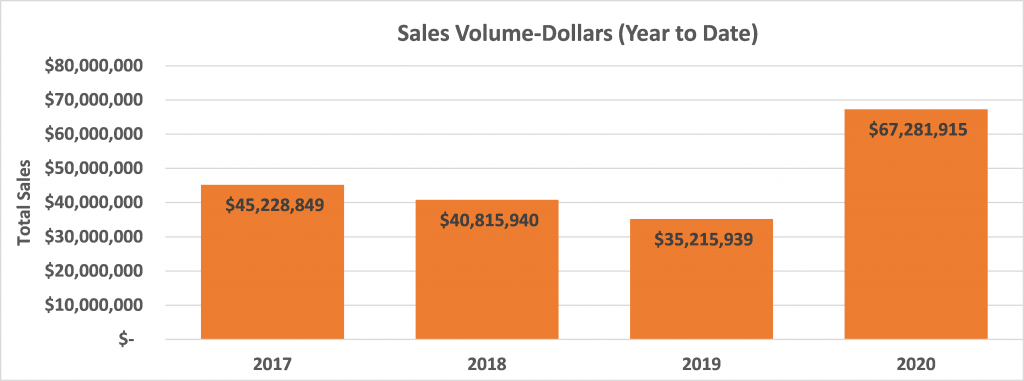
Year to Date Sales Volume (Jan 1 – Feb 6):
In the chart below, you can see 2020 has a much higher sales volume than in previous years. In fact, sales volume is up 91% from last year. For both 2019 and 2018, there was a decrease in sales volume from the previous year. Interest rates could have something to do with this. For November 2018, the 30-year interest rate was (4.94%) the highest that they had been since February 2011 (5.05%). Since then, there has been a steady decline in interest rates. In January 2020, interest rates were mostly between 3.50% and 3.75%. This is making homes more affordable for consumers.
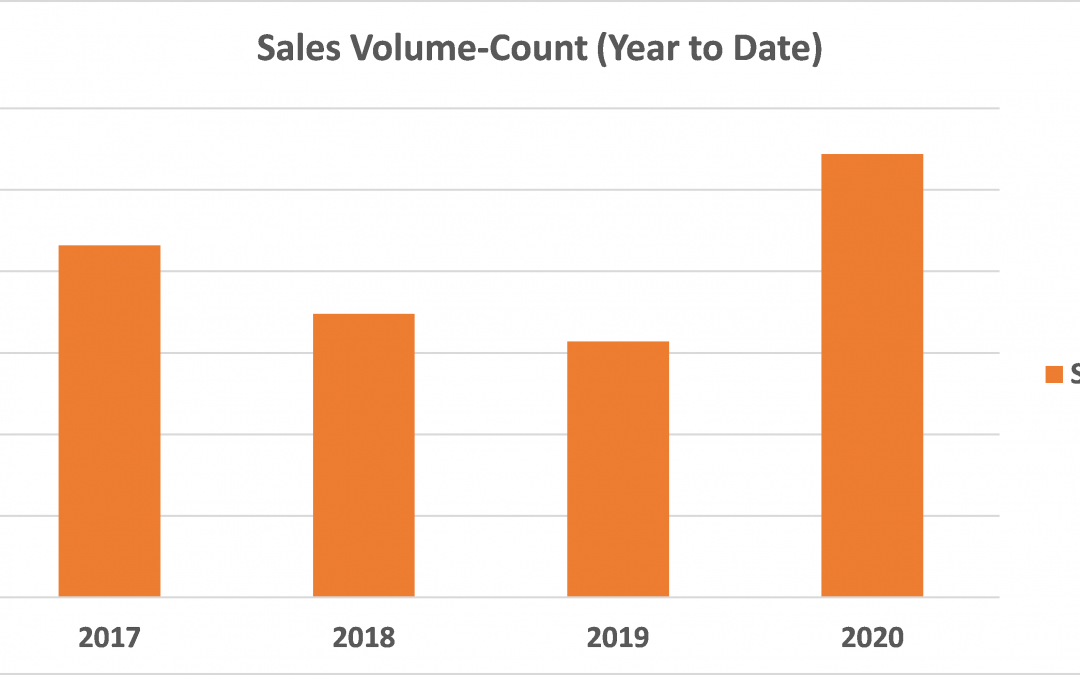
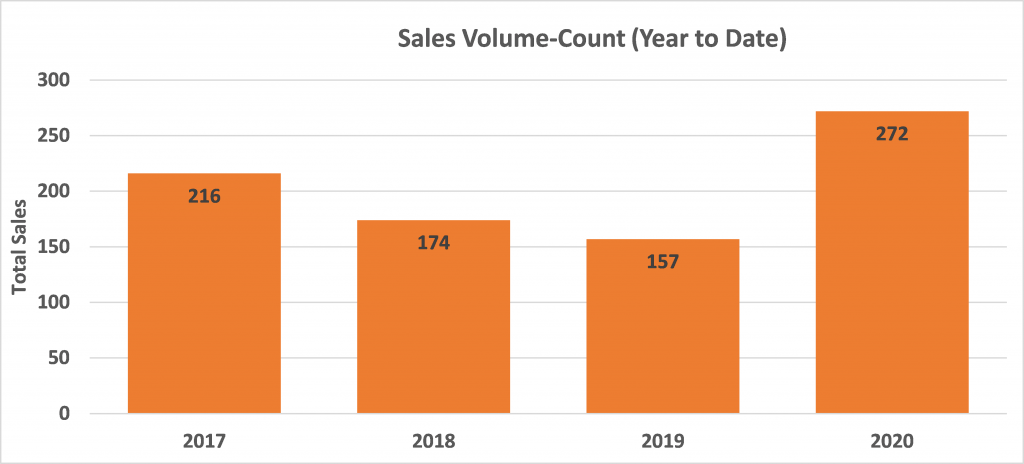
The chart below shows the number of sales in the area. Again, in January 2020, there were more sales than in the previous 10 years for the month of January. There was a 73% increase in the number of sales for 2020 as compared to 2019. Again, this is a favorable indicator for the market area.
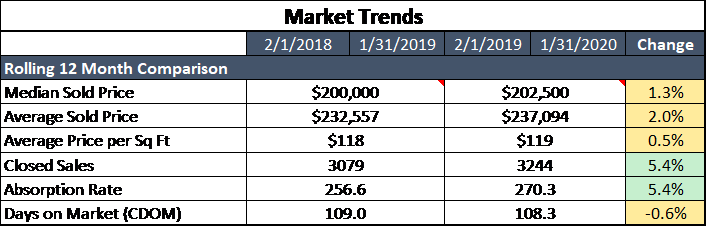
Trending 12 Months Sales Volume (Ending on 1/31/2020):
In last month’s market update, the trending 12 months statistics were all favorable. The trend continues this month. In fact, the median sales price, average sales price, and the average price per square foot are all up from last month’s analysis. Although the analysis is indicating values are stable, the statistics continue to move in a favorable direction. This is good for sellers who are trying to sell their homes because it is taking less time to sell their homes and the sales prices are increasing.
Conclusion:
So far it has been a strong start in the real estate market for 2020. The trend is expected to continue in the near future. At the end of January 2020, there were 307 pending properties in Lafayette Parish. This is a 16.7% increase from January 2019 that had 263 pending properties. With interest rates at a three year low, it is reasonable to expect this trend to continue for the first quarter of 2020.
If you have any appraisal related questions, please do not hesitate to contact me. 337-254-2215 or Lduple4@gmail.com
I hope everyone enjoys the Mardi Gras festivities over the next few weeks. Until next month, laissez les bons temps rouler!!!
Data Source: MLS, detached single-family homes sold in Lafayette Parish